

Open Earth
OPTIMIZING DELIVERY & UX

SCOPE OF PROJECT
OPTIMIZING DELIVERY AND UX

Timeline: September 2020 - January 2021
What We Did: Analyzed order assignment inefficiencies, developed strategies for optimizing racer assignments, Explored predictive modeling for customer purchases, designed an algorithm for product ranking
Tools: Python, SQL, ML Modeling, Data Analytics Frameworks
Goal of Project
Examine Open Earth’s current data processing pipeline
Assess the Data Quality through quantitative measures
Create models that filter the data formats
Implement these filters into OpenEarth’s data processing step
Guiding Question
Emissions data is not standardized, so how can we fix this issue?
What is Open Earth?
OpenEarth is a foundation that creates open-source technology and data architecture to scale planetary climate action. As a year-long effort, DSU partnered with OpenEarth to work with them to analyze global emissions data, and perform various tasks that ultimately led to focusing on a new project: getting emissions data straight to city governments! Emissions data from around the world can come in a variety of formats depending on country, state, county, and even at the city level. We worked with OpenEarth to fix problems with their data pipeline processing outdated, inaccurate, and unintuitive data formats, and simplified the overall “data experience” for city governments.

Data Preprocessing – Clean and normalize emissions data for consistency across regions and reporting standards.
Feature Selection – Identify key predictors (e.g., industrial activity, population growth, energy consumption) that influence emissions trends.
Training a Linear Regression Model – Develop a simple, interpretable model to establish a baseline for emissions forecasting.
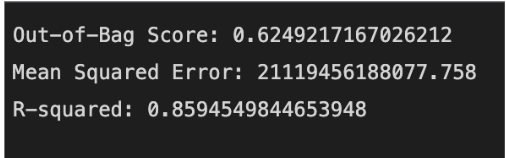
Error Analysis & Model Evaluation – Assess model performance using metrics like Mean Absolute Error (MAE) and R² score.
Phase 1: Linear Regression Model

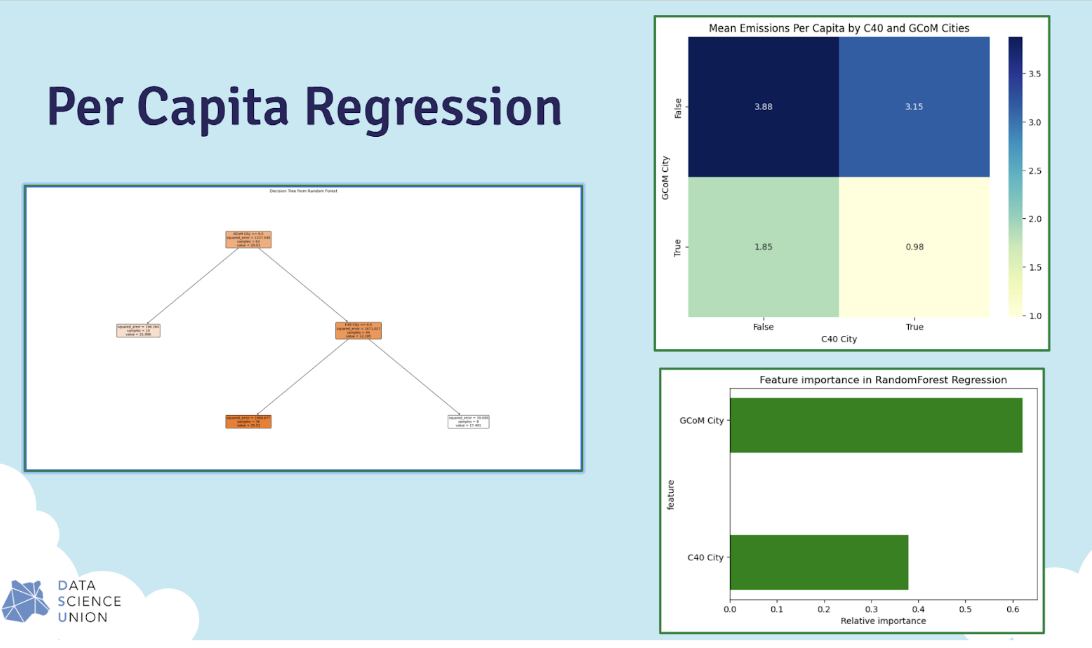
Phase 2: Random Forest Regressor

Feature Engineering & Expansion – Introduce additional variables (e.g., weather patterns, transportation data) to improve model robustness.
Hyperparameter Tuning – Optimize the Random Forest model by adjusting tree depth, number of estimators, and feature sampling methods.
Cross-Validation & Performance Benchmarking – Compare model accuracy against the baseline linear regression model.
Interpretability & Feature Importance Analysis – Identify key drivers of emissions fluctuations using feature importance scores.
Phase 3: Data Standardization & Schema Design
Establish a universal schema for emissions data that can accommodate various regional formats while ensuring consistency.
Our Impact
By integrating and standardizing emissions data, OpenEarth empowers city governments with reliable, actionable insights for climate policy and urban sustainability. The new system not only improves data accuracy but also simplifies access, enabling cities to track emissions trends effectively and implement evidence-based climate action. Through this initiative, OpenEarth contributes to global efforts in reducing carbon footprints at the municipal level, fostering a scalable model for climate data transparency and governance.